Praise the Metal – Epilogue

Oh, look, another post about Metal.

Don’t worry, I promise this will be the last one, at least for a while.

In this final post in the Metal series, I’ll make a summary of what we’ve achieved so far, the good and bad decisions, and some forecast for future improvements.

Let’s finish this…

What went right?

Working on an actual project instead of a demo. The first Metal demo was lacking a lot of features and was more of a test drive that helped me understand how the API worked. On the other hand, Le Voyage was already published by the time I start porting it to Metal, so whatever I ended up implementing had to support a minimal set of functionalities if I wanted to be part of the game. In addition, it helped me to focus on specific features rather than go with a more generic implementation. For example, there was no need for skeletal animation, so I skipped that feature completely.

Metal benefits showed up from the very beginning. Metal started to show its strength as soon as I completed the most basic implementation. The frame rate was up to at least 50% and the game felt much more fluid, even with all effects turned on and running at Retina resolutions. And this was before any optimization were even considered.

Crimild’s design was up to the task and did not require any major modifications. Honestly, this was a nice surprise. When I started working with Metal, one of my biggest concerns had to do with what changes were required in Crimild (specially at core-level libraries) in order to support the new paradigm. This, in turn, might have side effects on other implementations, which are [supposed to be] much more stable. But it turned out that it was possible to encapsulate all Metal hacks code within the Renderer itself. No major design changes were required and I was really happy about that.

Switching between OpenGL and Metal in iOS is done with a single flag. This was critical in order to understand how well the new renderer performed. The CrimildViewController class has a single flag that defines whether or not to use Metal. Most importantly, it will fallback to OpenGL automatically for those platforms that don’t support Metal.

Metal shaders are a win. I love the way Metal works with shaders and since they are precompiled along with the rest of the application, there’s no need for extra error handling at run-time. And the errors are really easy to understand.

GLSL translated fairly straightforward to Metal’s shading language. The language itself is a bit different, since MLSL is based on C++11 instead of ANSI C, yet the logic behind the shaders is pretty much the same. And the MLSL Standard Library provides much of the tools that are available in GLSL too. I’m still not sure how to achieve a level of abstraction for writing shaders regardless of the platform, thought (as I’m doing with GLSL).

Image effects are easier to work with on Metal. Handling FBOs turned out to be much easier than in OpenGL. The API is a lot less verbose and error checking is much more straightforward. This lead to a more simpler way to achieve post-processing effect. And, as I mentioned in a previous post, I still need to use one of Metal features to avoid using a vertex or fragment shader function if not needed with should make things even easier.

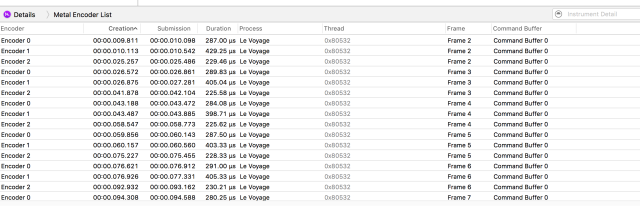
The tools. Both Xcode and Instruments were upgraded with a set of tools that made my life a lot easier when profiling and optimizing Le Voyage. The Frame Navigator and Shader Profiler were particularly useful for finding those bits of code that were causing the most performance problems.

It took me more time to write these posts than to actually implement the whole thing. I’m not a fast writer, that’s true. Still, implementing the entire rendering solution based on Metal was a lot easier than what I originally estimated. The API is really well documented and the example code provided by Apple is clear and easy to follow.

What went wrong?

Metal only work on selected platforms. This is my main concern for Metal, since it only works on selected Apple devices. For what I’ve seen so far, working with Metal is pretty similar as working with Vulkan, but we still need to maintain both APIs. And OpenGL too, of course

The Metal API require us to do more things than in OpenGL. While it’s true that some functionalities were easier to implement in Metal, most of the time the API was more verbose than it’s counterpart in OpenGL. But this was expected, due to Metal is supposed to be a more low level API. On the plus side, the mechanisms that required more code usually where invoked only once at the beginning or at very low rates.

FBOs are required for all render passes. The Metal Renderer assumes at least a forward-like render pass, with support for offscreen frame buffers by default. This leaves out Crimild’s basic render pass that is used for rendering scenes that don’t require too much graphic complexity.

Translation between Metal and Crimild object was not always straightforward. I said before that there was no need for major design changes in Crimild. That was one of the design goals from the beginning. But in order to keep this statement true, I ended up doing some weird conversions and hacks, like assigning render pipelines to shader programs instead of materials.

Uniform buffers could have been handled in better way. I said it before and I’m saying it again: I really don’t like the way I ended up implementing uniform buffers in Crimild. Probably, it was due to the lack of experience on my side but this is definitely a point of improvement for further versions.

No C API for Metal. The Metal API is completely written in Objective-C, which lead to some weird code and argument passing in the final implementation. It never represented a problem since I’ve worked with mixed code before, but the code looks funny. The object-oriented API design is a plus, thought.

What’s next?

I assume there’s going to be several improvements for Crimild’s Metal support in the near future as I start using it for other projects. Again, I don’t like the way uniforms are handled, so that’s going to be my first focal point for sure.

In addition, I’m planning on supporting deferred rendering in Metal and improve the lighting model to support PBR at some point, too.

Finally, at WWDC 2016 last week Apple announced  some new features for Metal that I would love to include in future versions. For example, Metal now supports dynamic polygon tessellation. In concept, it seems similar to OpenGL’s geometry shaders and I know for a fact that in order to support such feature I need to change the shader design in Crimild. But that’s on my wish list too.

Final words

Well, that’s it. I’m done.

aunlocked

I’ve never wrote this much about anything before, so this was a clear achievement for me, beyond Metal itself. I can’t promise that I will keep this pace for future Crimild features, thought. So don’t get too excited.

As usual, feel free to look at the code in Github and provide comments. Crimild’s Metal support is still experimental (look for the devel branch), but it will be included in the next released anyways. And if you wanted to see it in action, go and download Le Voyage in the App Store if you haven’t played it already.

All in all, it has been a great journey. I was hyped by Metal from the beginning but I wasn’t expecting such amazing results considering the small amount of time that I invested.

Now that I know the power of Metal, I can’t wait to get my hands on Vulkan…


Praise the Metal – Part 7: Profiling and Optimizing our App

As we approach the end of our journey, one question pops up in our head: was it worthy? Why did we face all the challenges of this new paradigm introduced by Metal? What exactly did we gain from all this? What is life?

Fortunately for us, Xcode comes with several tools that will let us answer these questions (maybe not the last one). So, without further ado, let’s take a look at them…

42?

The following image shows a capture of a single frame in Le Voyage:

Screen Shot 2016-06-16 at 10.52.50 AM.png

On the left, we have the Frame Navigator displaying all states and draw calls present on the frame, grouped by type (i.e. render encoder, command buffers, data buffers, etc). There’s an option to switch between viewing the frame by draw calls or by performance. I find the latter one much more useful when looking for optimization points, due to the timings displayed for each operation:

Screen Shot 2016-06-16 at 11.16.33 AM.png

In the center of the screen we have the Attachment Viewer. Since Crimild does not support multiple attachments for Metal at the moment, only the first color attachment is shown above.

It’s important to note that, as we move in the frame navigator, the attachment color can display partial results. For example, it’s possible to display the scene with and without the post-processing filter by selecting the corresponding render command encoder on the left.

Screen Shot 2016-06-16 at 11.00.18 AM.png

The Resource Inspector will show all resources currently in use for the given frame

Screen Shot 2016-06-16 at 11.06.19 AM.png


Notice both source and accumulation framebuffer objects in the right hand panel, as well as textures and data buffers. For textures, we can see not only the source image, but also mipmap levels, cube maps, etc. Regarding buffers, we can check their contents as well.

Finally, the State Inspector is shown at the bottom of the screen, allowing us to inspect properties for all available Metal objects.

Moving on, there’s the GPU report providing measurements in frames per second and timings for both CPU and GPU processes. The most expensive render operations are shown as well, indicating which shaders and draw calls we should focus when optimizing.

Screen Shot 2016-06-16 at 11.12.18 AM.png

But maybe the most interesting tool of all is the Shader Profiler and editor.

Screen Shot 2016-06-16 at 11.19.24 AM.png

Not only it’s possible to edit and recompile shaders on the fly, but have you notice the grey bars with the numbers in the image above? Those values indicate which operations are the most expensive (relative to that shader) and the ones that should require our attention. Yes, the profiler will show which lines are the slowest ones!!

Also, notice the warning marks? Good guy Xcode will tell us when we’re doing things wrong with clear messages:

Screen Shot 2016-06-16 at 1.02.32 PM.png

Did I mention that all this works on iOS? Amazing!

What about Instruments?

But wait, there’s more. All the tools in Xcode are incredible useful, yet it’s the Metal System Trace in Instruments the one that really shines, allowing us to profile both the CPU and the GPU down to the microsecond level.

Screen Shot 2016-06-16 at 11.28.03 AM.png

The image above shows an in-depth look at our application’s graphic workload over time across all layers of the graphics stack. Starting with the CPU at the top, the new trace tool will let us inspect shader compilations, driver activity, each of the individual command stages and, finally, the drawables themselves.

It’s worth mentioning that this new tracer works a bit different than the one for OpenGL, as we won’t get the profiler analysis in real-time. Once we start the tracing tool, it will start recording the app indefinitely until stopped and only then we will be able to see the results. This is called Windowed Mode by Instruments.

In the timeline, colors are used to identify each frame so we can easily track their start and end times and how long it took until they were displayed. Probably the one that will require most of our attention is the white color, since that basically means wasted time. I’ll explain this later in this post.

The Details Panel at the bottom of the screen is also very useful. For example, the image below show timings for each of the encoders in a very clear way

Screen Shot 2016-06-16 at 11.46.37 AM.png

Things to look for

The tools are great, but what exactly do they show us? When looking at the timelines and traces, we should keep an eye for the following:

  • CPU and GPU parallelism, indicated by how sparse the operations are from one another. Basically, try to minimize the white spaces in timelines. A white space may indicate that either the CPU is waiting for the GPU or viceversa. This was the very first problem I try to solve for Le Voyage.
  • Pattern breakers. Each frame should look pretty much the same as the previous one. Therefore, any timing spike or new operation should be analyzed and refactored if needed.
  • Surfaces should not be displayed for more than one vsync operation. If so, it’s indicating that a frame is taking more time to process than what we’re expecting which could end up hurting our targeted FPS. For example, if a surface is displayed in between two vsync calls, we’re running at 30fps instead of 60fps.
  • Avoid shader compilation at run-time. Shaders should be pre-compiled if posible and almost no activity should be visible in the Shader Compilation stack. In Le Voyage, all shaders are pre-compiled.
  • Aim to profile early and often.

This list is by no means complete, but it’s enough to avoid the most common performance problems with a Metal application.

Best Practices and Optimizations

OK, there are a lot of best practices to follow. For the sake of brevity, I’m going to focus only on those that made the biggest impact while optimizing Le Voyage.

Expensive object creation upfront

Remember this graphic from the first post?

opengl vs metal

Well, we need to follow it by hearth. We should create the most expensive objects (buffers, pipelines, shader libraries, etc) as early in our application as possible and reuse them as much as we can. Avoid creating these objects in between frames, since they are the source of most performance bottlenecks.

Dynamic Shared Resources

Of course, there will be objects that simply cannot be create upfront. Think about uniform buffers, shader constants and dynamic textures, just to name a few. They may depend on which geometries are on the screen, which in turn are created dynamically too.

In these cases, the best approach is to use a pool of resources (i.e. buffers of a given size) and reuse them whenever required. The number of preallocated resources could vary depending on the requirements of our app, but can be easily adjusted on the fly. Keep in mind that you may need some sort of synchronization mechanism (as in semaphores) in order to ensure that this approach works on parallel systems.

Now, go back to the very first image in this post. Notice all those warning marks? Well, that’s a good indication that we’re creating too many objects during a frame and probably most of them can be replaced by object pools (spoiler alert: they can and they will).

CPU-GPU Parallelism

As I mentioned before, switching to Metal provided a great performance boost in Le Voyage from the very beginning. Even so, after executing the first trace I noticed that there was pretty much no parallelism at all between the CPU and the GPU, meaning they were waiting on each other most of the time. Look at this timeline:

Screen Shot 2016-06-16 at 12.38.19 PM.png

As we can see, the CPU works on a frame and then waits for that frame to be displayed in order to continue on the next one. Look at all that white space. This is clearly inefficient.

It turned out that there was a very simple optimization to be done here. The image above shows the app working with only one command buffer active at any given time and therefore there was no way to achieve parallelism. All it took to improve this was to change the number of in-flight buffers from 1 to 3 and that lead to a much better result:

Screen Shot 2016-06-16 at 12.47.15 PM.png

Now, as one frame is being displayed, the CPU can start processing the next ones almost immediately, ensuring parallelism in our render loop.

Acquire drawables at the latest opportunity

So far we’ve been talking about doing most things upfront. Well, not everything should be done in this way.

As it was defined before, a drawable is the visible output for our app (usually, that would be the screen). A Metal layer has a limited number of drawable objects for us to use, which are returned at display intervals. That means that we need to wait for a drawable to be ready in order to start drawing into it.

Remember this line from a previous post?

_drawable = [getLayer() nextDrawable];

That’s a blocking operation. If a drawable is not ready, the app will wait for one. At 60fps that could be as long as 16ms. Not good.

In practice there’s no need to wait for drawables. After all, we first need to render the scene to an offscreen buffer in order to apply the post-processing effect. Only then we actually need a drawable to render the resulting frame on the screen. So, the Metal Renderer will process the frame in the offscreen FBOs first, and it’s only going to request a drawable when everything is ready to be displayed. This strategy hides long latencies if no drawables are available.

Multi-threaded render passes

This is something that I have in my wish list. Although Metal allow us to dispatch commands buffers on multiple threads, Crimild still implements render passes using a single threaded approach, a fact that comes from years of working with OpenGL.

The idea is to move to a fully parallel render pass at some point in the not so distant future (maybe when I start working with Vulkan), which will bring even more benefits for Metal. But for the moment, we’re stuck with a single-threaded approach. Sorry.

Closing Comments

Phew! This was a long post with too much information in it. When I started this series, the topic of profiling and optimizations was the one that I was most excited to write about. It truly shows the power of Metal and Xcode when working with graphical applications. Too bad the OpenGL tools are not a the same level.

Don’t miss the final post sometime next week, when I’m going to do a proper post-mortem for the whole adventure as well as give my thoughts about some future upgrades in Crimild. See you soon.

To be continue…


Praise the Metal – Part 6: Post-processing

I knew from the start that Le Voyage needed some kind of distinctive feature in order to be recognized out there. The gameplay was way too simple, so I focused on presentation instead. Since the game is based on early silent films, using some sort of post-processing effect to render noise and scratches was a must have.

About Image Effects

In Crimild, image effects implement post-processing operations on a whole frame. Ranging from simple color replacement (as in sepia effects) to techniques like SSAO or Depth of Field, image effects are quite powerful things.

Le Voyage makes use of a simple image effect to achieve that old-film look.

Screen Shot 2016-05-15 at 3.03.19 PM

There are four different techniques applied in the image above:

  1. Sepia tone: All colors are mapped to sepia values, which is that brownish tint. No more blues, reds or grays. Just different sepia levels.
  2. Film grain: noise produce in films due to luminosity changes (or so I was told)
  3. Scratches: Due to film degradation, old movies display scratches, burnts and other kind of artifacts after some time.
  4. Vignetting: The corners of the screen look more dark than the center, to simulate the dimming of light. This technique is usually employed to frame important objects in the center of the screen, as in closeups.

All of these effects are applied in a single pass for best performance.

How does it work?

Crimild implements post-processing using a technique called ping-pong, where two buffers are switched back-and-forth, serving as both source and accumulation while processing image effects.

A scene is rendered into an off-screen framebuffer, which is designated as source buffer. For each image effect, the source buffer is bound as a texture and used to get the pixel data that serves as input for an effect. The image effect is computed and rendered to a second buffer, known as accumulation buffer. Then, source and accumulation are swapped and, if there are more image effects to apply, the process starts again.

When there are no more image effects to be processed, the source buffer will contain the final image that will to be displayed on the screen.

Confused? Then the following image may help you (spoiler alert: it won’t):

IMG_0548
Ping-pong buffer. For each image effect, the source and destination buffers are swapped. Once all effects have been processed, the source buffer contains the final image

Le Voyage only uses one image effect that applies all four stages in a single pass. No need for additional post-processing is required. If you want to know more implementing the old-film effect, you can check this great article by Nutty.ca in which I based mine.

Powered by Metal

Theoretically speaking, there’s no difference concerning how this effect is applied in either Metal or OpenGL, as the same steps are required in both APIs. In practice, the Metal API is a bit simpler concerning handling framebuffers, so the code ends up more readable. And there’s no need for all that explicit error checking that OpenGL needs.

If you recall from a previous post where we talk about FBOs, I said that we need to define a texture for our color attachment. At the time, we did something like this:

renderPassDescriptor.colorAttachments[ 0 ].texture = getDrawable().texture;

That code sets the texture associated with a drawable to the first color attachment. This will render everything on the drawable itself, which in our case was the screen.

But in order to perform post-processing, we need an offscreen buffer. That means that we need an actual output texture instead:

MTLTextureDescriptor *textureDescriptor = [MTLTextureDescriptor 
   texture2DDescriptorWithPixelFormat: MTLPixelFormatBGRA8Unorm
                                width: /* screen width */
                               height: /* screen height */
                            mipmapped: NO];
 
id< MTLTexture > texture = [getDevice() newTextureWithDescriptor:textureDescriptor];

renderPassDescriptor.colorAttachments[ 0 ].texture = texture;

The code above is executed when generating the offscreen FBO. It creates a new texture object with the screen dimensions and set it as the output for the color attachment. Notice that we don’t pass any data as the texture’s image since we’re going to write into it.

Keep in mind we need two offscreen FBOs created this way, one that will act as source and the other as accumulation.

Once set, binding this offscreen FBO will make our rendering code to draw everything on the texture itself instead of the screen, which will become our source FBO.

Then we proceed to render the image effect, using a quad primitive and that texture as input and producing the final image into the accumulation FBO, which is then presented on the screen since there are no more image effects.

Again, this is familiar territory if you already know how to do offscreen rendering in OpenGL. Except for a tiny little difference…

Performance

When I started writing this series of posts, I mentioned that one of the reasons for me to work with Metal was that the game’s performance was poor on the Apple TV. More specifically, I assumed that the post-processing step was consuming most of the processing resources for a single frame. And I wasn’t completely wrong about that.

Keep in mind that post-processing is always a very expensive technique, both in memory and processing requirements, regardless of the API. In fact, the game is almost unplayable on older devices like an iPod Touch or iPhone 4s just because of this effect (and those devices don’t support Metal). Other image effects, like SSAO or DOF are even more expensive, so you should try and keep the post-processing step as small as possible.

I’m getting ahead of myself, since optimizations will be subject of the next post, but it turns out that Metal’s performance boost over OpenGL not only lets you display more objects in screen, but also allows for more complex post-processing effects to be applied in real-time too. Even without optimizing the shaders of the image effect, I noticed a 50% increment in performance just by switching the APIs. That was amazing!

Et Voilá

And so the rendering process is now completed. We started with a blank screen, and then proceeded to draw objects in an offscreen buffer. Finally, we applied a post-processing effect to achieve that old-film look giving the game that unique look. It was quite the trip, right?

In the next and (almost) final entry in this series we’re going to see some of the amazing tools that will allow us to profile applications based on Metal, as well as some of the most basic optimization techniques that lead to great performance improvements.

To be continued…